ATLAS collects data from every department — production, sales, collections, HR — moves what is stuck on paper onto a screen, and answers like a data manager the moment you ask. Tirelessly, around the clock, inside your own company.
Production sits in a spreadsheet, sales in a database, collections in accounting, leave records in HR — and some of it nowhere at all: in the shift log, on a delivery note, in a messaging group.
Filled in by whoever is around at the end of the shift.
You have to ask someone to pull a report.
You get lost in the customer-ledger screen.
Gone by the end of the day; nobody remembers it by month-end.
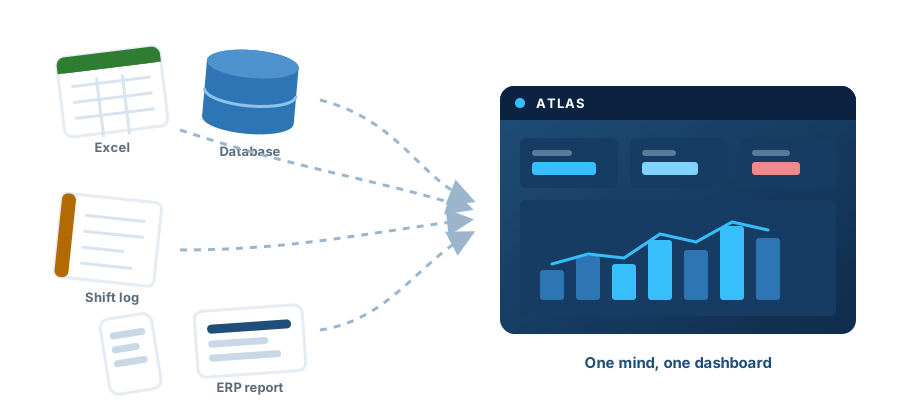
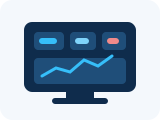
Data from every department merges into a single dashboard, and everyone looks at the same current number.
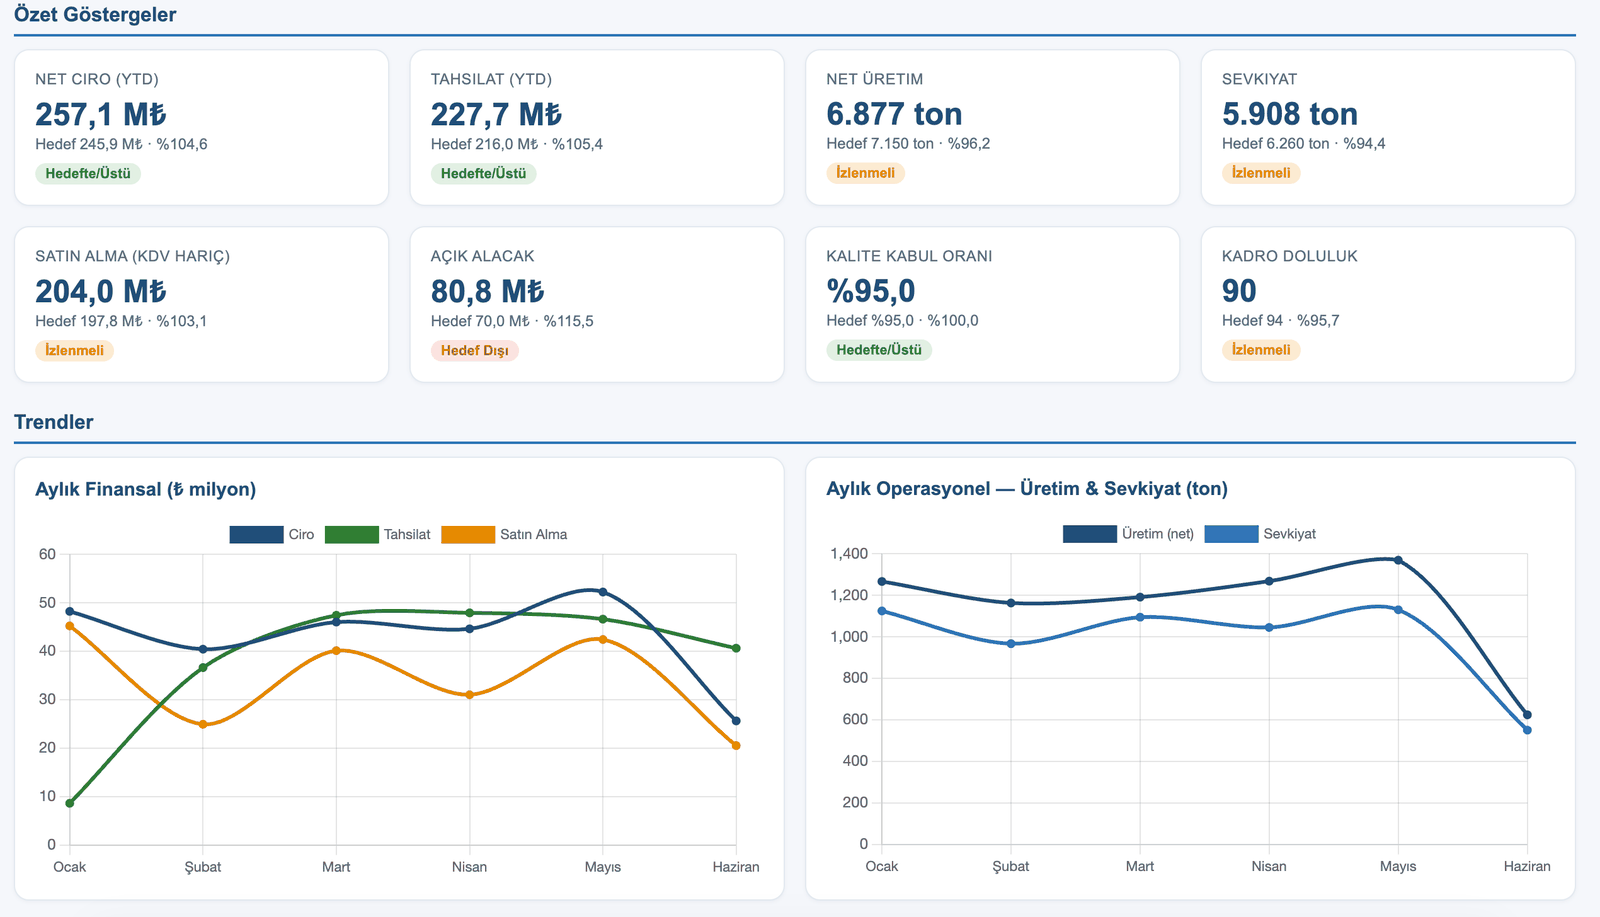
The screen below was produced from the real data of the PÜRSU Paper case study. Target vs. actual, status labels and trends, all at a glance.
It does not just read the data you already have — it fixes the place where data is born.
Reads SQL databases, Excel files, Google Sheets, ERP reports and department files, and brings them together in one place.
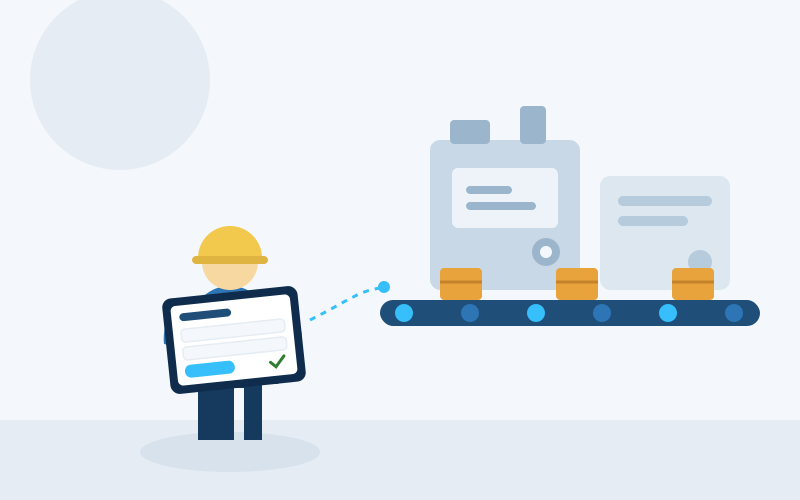
For processes still living on paper, it builds department-specific entry screens that can be filled in from a phone.
Not a raw table but an insight you can decide on: “Revenue is on target, but collections are slipping.”
No spreadsheets, no formulas — you ask, and it answers from the real numbers.
The dashboard refreshes as the data changes. You see this moment, not yesterday.
It tells you before you ask: “28.8% of your purchases come from a single supplier — that is concentration risk.”
Your Excel files, your Google Sheets, your SQL database and your ERP reports stay exactly where they are. ATLAS reads them as they are. It never writes to any of your systems.
Shift log, timesheet, delivery note — for these processes it builds three-tap entry screens. Information enters the system the moment it is born; nobody sits down in the evening to copy it into a spreadsheet.
ATLAS speaks each department's language. The production manager calls it “waste” and the CEO calls it “cost” — ATLAS gives both of them the right answer.
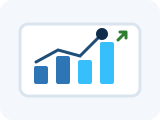
Target vs. actual, department health score, risky-month detection.
Explore →Revenue, rep and region performance, customers going quiet.
Explore →Net output, waste rate, capacity utilisation, downtime.
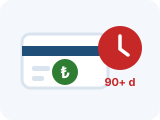
Explore →DSO, overdue receivables ageing, VAT summary.
Explore →On-time delivery rate, sell-through, dead stock.
Explore →Budget variance, unit cost trend, supplier risk.
Explore →Absenteeism, overtime cost, leave balances.
Explore →Pass/fail rate, defect-type distribution, complaint trend.
Explore →Each department's pain, the metrics it tracks, sample questions and its dashboard.
ATLAS runs on your own computer. Your revenue, your customer list and your employee records are never copied to somebody else's server. With the local-model option nothing goes out at all — you do not even need an internet connection.